Scarecrow explains
The pH scale:
The pH scale is a measure of how acidic or alkaline a solution is. Most solutions you will encounter in a school lab have pH values between 0 (highly acidic) and 14 (highly alkaline), although it is possible for acids to have pH values well below 0 and for alkalis to have pH values over 14. The pH of a neutral solution is 7.
Acids have low pH values because, when they dissolve in water, the acid molecules dissociate (separate) to form hydrogen ions, H+. Alkalis have high pH values because, when they dissolve in water, the alkali molecules dissociate to form hydroxide ions, OH−.
The pH of a solution is determined by the concentration of hydrogen ions, H+, in the solution: the higher the H+ concentration, the lower the pH. pH is not a linear scale but a logarithmic scale; this means that each step up or down the pH scale corresponds to a tenfold change in H+ concentration. One step down the pH scale represents a 10-times increase in the H+ concentration; one step up the pH scale represents a 10-times decrease in H+ concentration. This is illustrated in the diagram below:
When taking multiple steps along the pH scale, the tenfold changes stack up, for example:
- Going from pH 4 to pH 2, the H+ concentration increases by a factor of 100 because this is two steps, so the H+ concentration is multiplied by 10 and then by 10 again.
- Going from pH 3 to pH 6, the H+ concentration decreases by a factor of 1000 because this is three steps, so the H+ concentration is divided by 10, then another 10 and then another 10.
What about when the pH is greater than 7?
In the same way that the behaviour of acids is caused by the H+ ion, the behaviour of alkalis is caused by the hydroxide ion, OH−. At pH values above 7, there is an excess of OH− ions relative to H+ ions, and every step up the pH scale represents a tenfold increase in the concentration of OH− ions.
Post-16 only: Given the above, you might be wondering why the pH scale has switched from measuring H+ concentration to OH− concentration, and the answer is that it hasn’t! To understand this, we need to look a little more closely at water. Water molecules have the ability to break up into ions—known as self-ionisation—such that at 25 °C, roughly one in every 550 million water molecules dissociates into H+ and OH− ions in a reversible reaction:
At pH 7, the concentrations of H+ and OH− ions are equal. We have already seen that every step down the pH scale represents a tenfold increase in H+ concentration, which is achieved by adding acid molecules, and every step up the pH scale represents a tenfold decrease in H+ concentration, so how can the H+ concentration be decreased below the level seen in pure water? The answer is to do with the equilibrium above. Adding additional hydroxide ions to water at pH 7 (for example, by dissolving sodium hydroxide) also has the effect of reducing the concentration of H+ ions. In fact, every tenfold increase in OH− concentration results in a further tenfold decrease in H+ concentration, so as we increase pH above 7, we continue to see the same tenfold decrease in H+ with each step.
Neutralisation reactions:
When H+ ions collide with OH− ions, they react to form water. This is known as a neutralisation reaction.
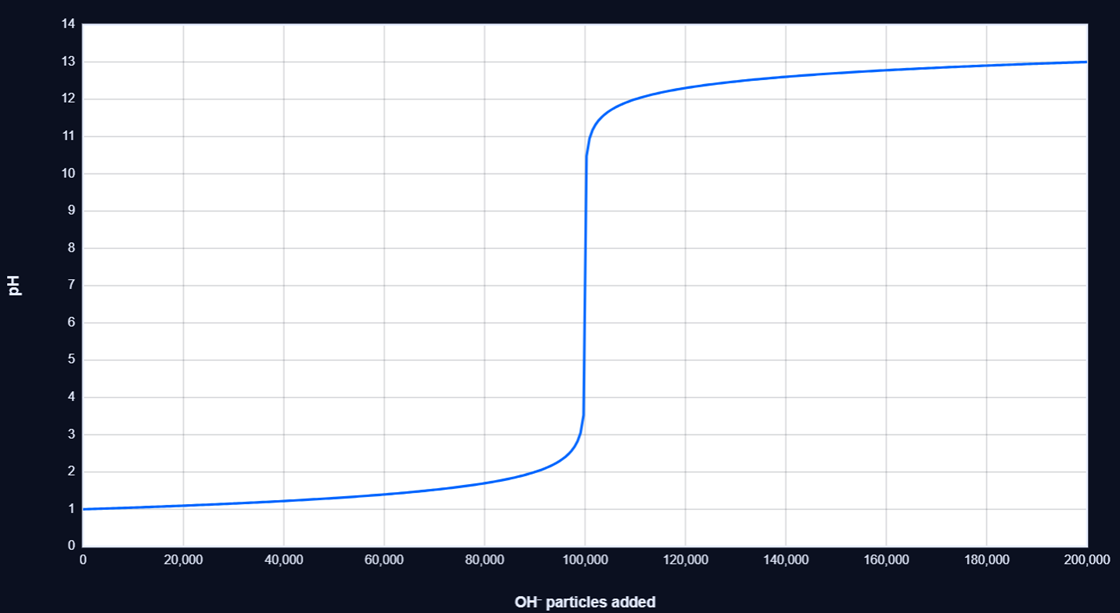
As you add an alkali (OH− ions) to an acid, due to the tenfold nature of the pH scale, you have to neutralise 90% of the H+ ions for the pH to increase by one (leaving 10% of the H+ ions untouched), which takes a large amount of alkali. To increase the pH by a further one, you need to neutralise 90% of the remaining H+, which is only 9% of the original amount, so it takes ten times less alkali to go up the second pH point compared to the first. This pattern continues such that, in a typical school lab experiment, the pH can go up by several points from about pH 5 to pH 9 with the addition of a single drop of alkali, producing graphs that have the characteristic shape shown below.
Note: In this simulation, when H+ and OH− react, a blue water molecule is formed; however, it disappears after 5 seconds to avoid visual clutter.
Indicators
Substances that change colour depending on the pH are known as indicators. Most indicators have just one colour change, such that, with the addition of a single drop of an alkali or acid, they change from one colour to another, indicating whether the solution is acidic or alkaline (Note: most indicators don’t change colour at pH 7, but they do normally change colour in a pH range where the concentrations of H+ and OH− are so low that it takes only a very small quantity of acid or alkali to significantly change the pH). As such, indicators are not generally used to measure the pH, but to determine whether the pH is above or below the range in which the indicator changes colour.
Universal indicator is made of a mixture of indicators, so it has a large number of colour changes across the pH range; however, it still should not be used to measure pH due to the difficulty of accurately measuring a colour.
Try this in the simulation:
- With pH changes by set to H+ count, drag the pH slider left below 7 and note how decreasing the pH by 1 increases the H+ count by a factor of 10. Increase it above 7 and note that there is a similar effect with OH− ions.
- With pH changes by set to Volume, and Acid or alkali set to Acid, drag the pH slider left and notice how keeping the H+ count the same but reducing the volume by a factor of 10 decreases the pH by 1 because the concentration (H+ per unit volume) increases by a factor of 10. Note also how dragging the slider right increases the volume by a factor of 10 whilst keeping the H+ count the same, which increases the pH by 1.
- With pH changes by set to H+ count, choose an indicator from the Indicator drop-down and drag the pH slider through its full range to see the colour of the indicator at each pH.
- With pH changes by set to H+ count, drag the pH slider to pH 2: 10,000 H+ ions. Click the + symbol next to Add ions (neutralisation), and then, under Add hydroxide ions, click the 9k button to add 9000 hydroxide ions and increase the pH by one. Now click the 900 button to see that to go up the next pH unit only takes 10% as much hydroxide as it did to go up the previous pH unit.
Simplifications:
In order to demonstrate the key concepts more clearly, this simulation makes a number of simplifications and compromises:
- You will see that at pH 6 there is one H+ ion, while at pH 4 there are 100. This does not mean that a real pH 6 acid contains one H+ ion and a real pH 4 acid contains 100 H+ ions, but that, at pH 4, the concentration of H+ ions is 100 times greater than at pH 6.
- The simulation’s pH slider only runs from 1 to 13 rather than the more normal 0 to 14; this is because of the technical limitations of drawing the million particles that pH 0 and pH 14 would require.
- The simulation displays a simplified representation of the dominant ion population, not the complete contents of the solution; strictly speaking, both H+ and OH− ions are always present.
- In Volume mode, what is actually being modelled is area rather than volume because it keeps the visuals simple. In reality, provided the number of H+ particles is kept constant, it is volume that actually affects pH, as this affects the concentration.
- When adding ions for neutralisation, the volume remains fixed, which would not be the case in real life and results in pH changes that, whilst showing the correct general pattern, are not fully realistic.
- The simulation and explanations generally refer to H+ ions to keep things accessible for younger students, but in reality, H+(aq) does not exist and actually represents the hydronium ion H3O+(aq); so, for example, the self-ionisation of water should really be represented as:
2H2O(l) → H3O+(aq) + OH−(aq)